Task:
Create a presentation that effectively communicates complex statistical data in a visually appealing, clear, and easily understandable format, tailored to the target audience.
Create a presentation that effectively communicates complex statistical data in a visually appealing, clear, and easily understandable format, tailored to the target audience.
Solution:
To achieve this, I applied principles of information architecture and data visualization to transform raw data into an intuitive and impactful presentation. The process began with an in-depth analysis of the provided data to identify key insights and trends most relevant to the audience. By prioritizing the most significant data points, I ensured that the final presentation focused on delivering clear and concise messaging.
To achieve this, I applied principles of information architecture and data visualization to transform raw data into an intuitive and impactful presentation. The process began with an in-depth analysis of the provided data to identify key insights and trends most relevant to the audience. By prioritizing the most significant data points, I ensured that the final presentation focused on delivering clear and concise messaging.
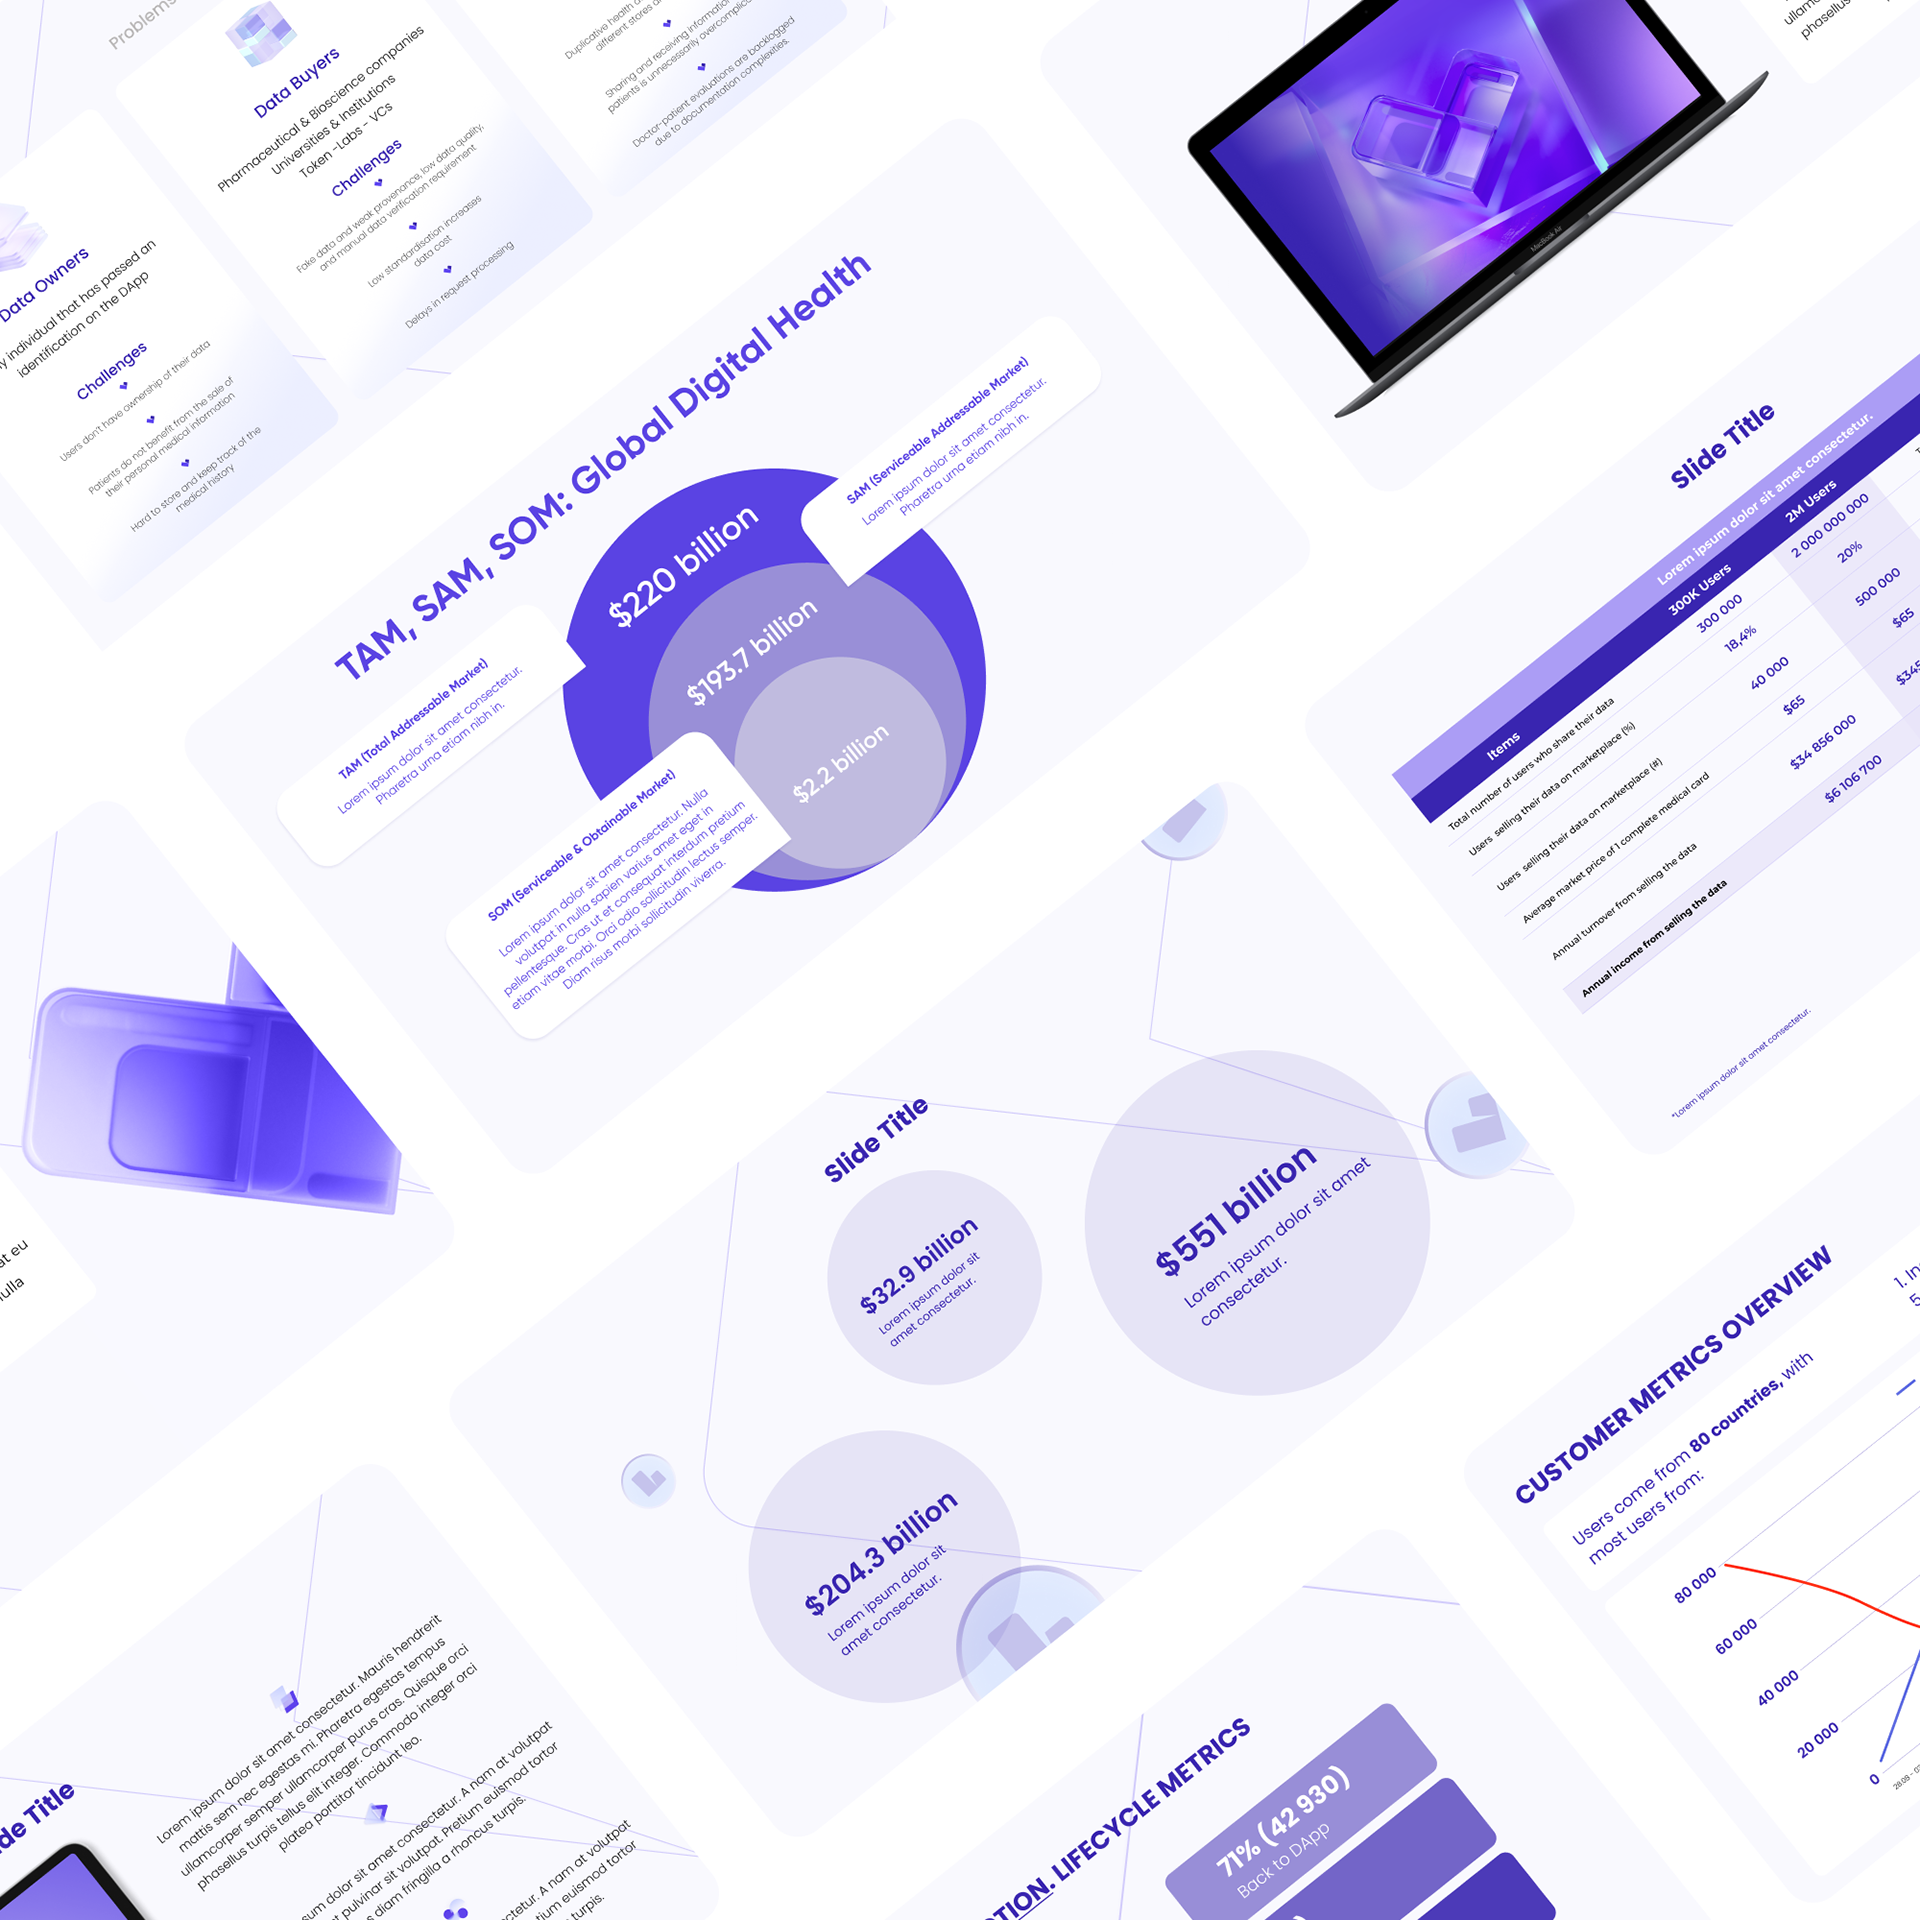
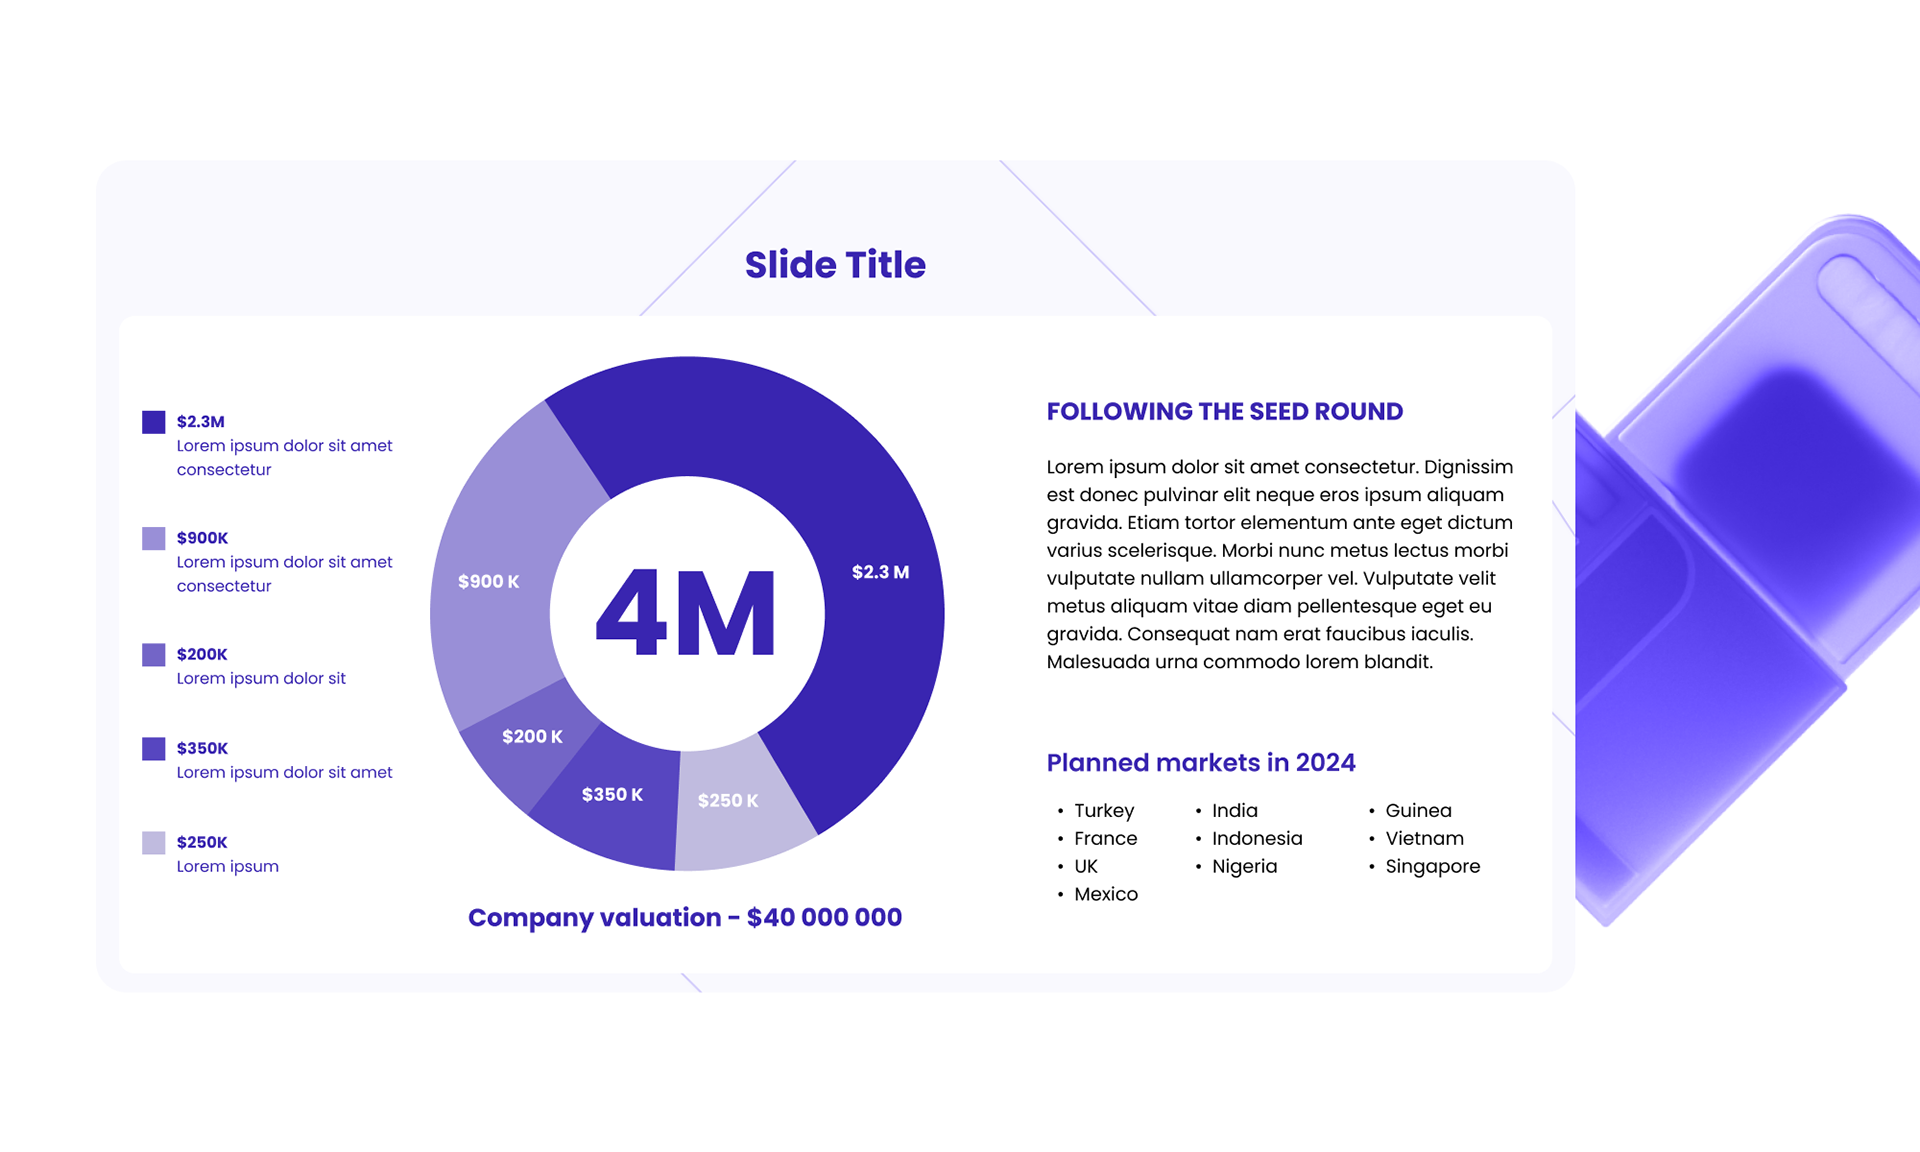
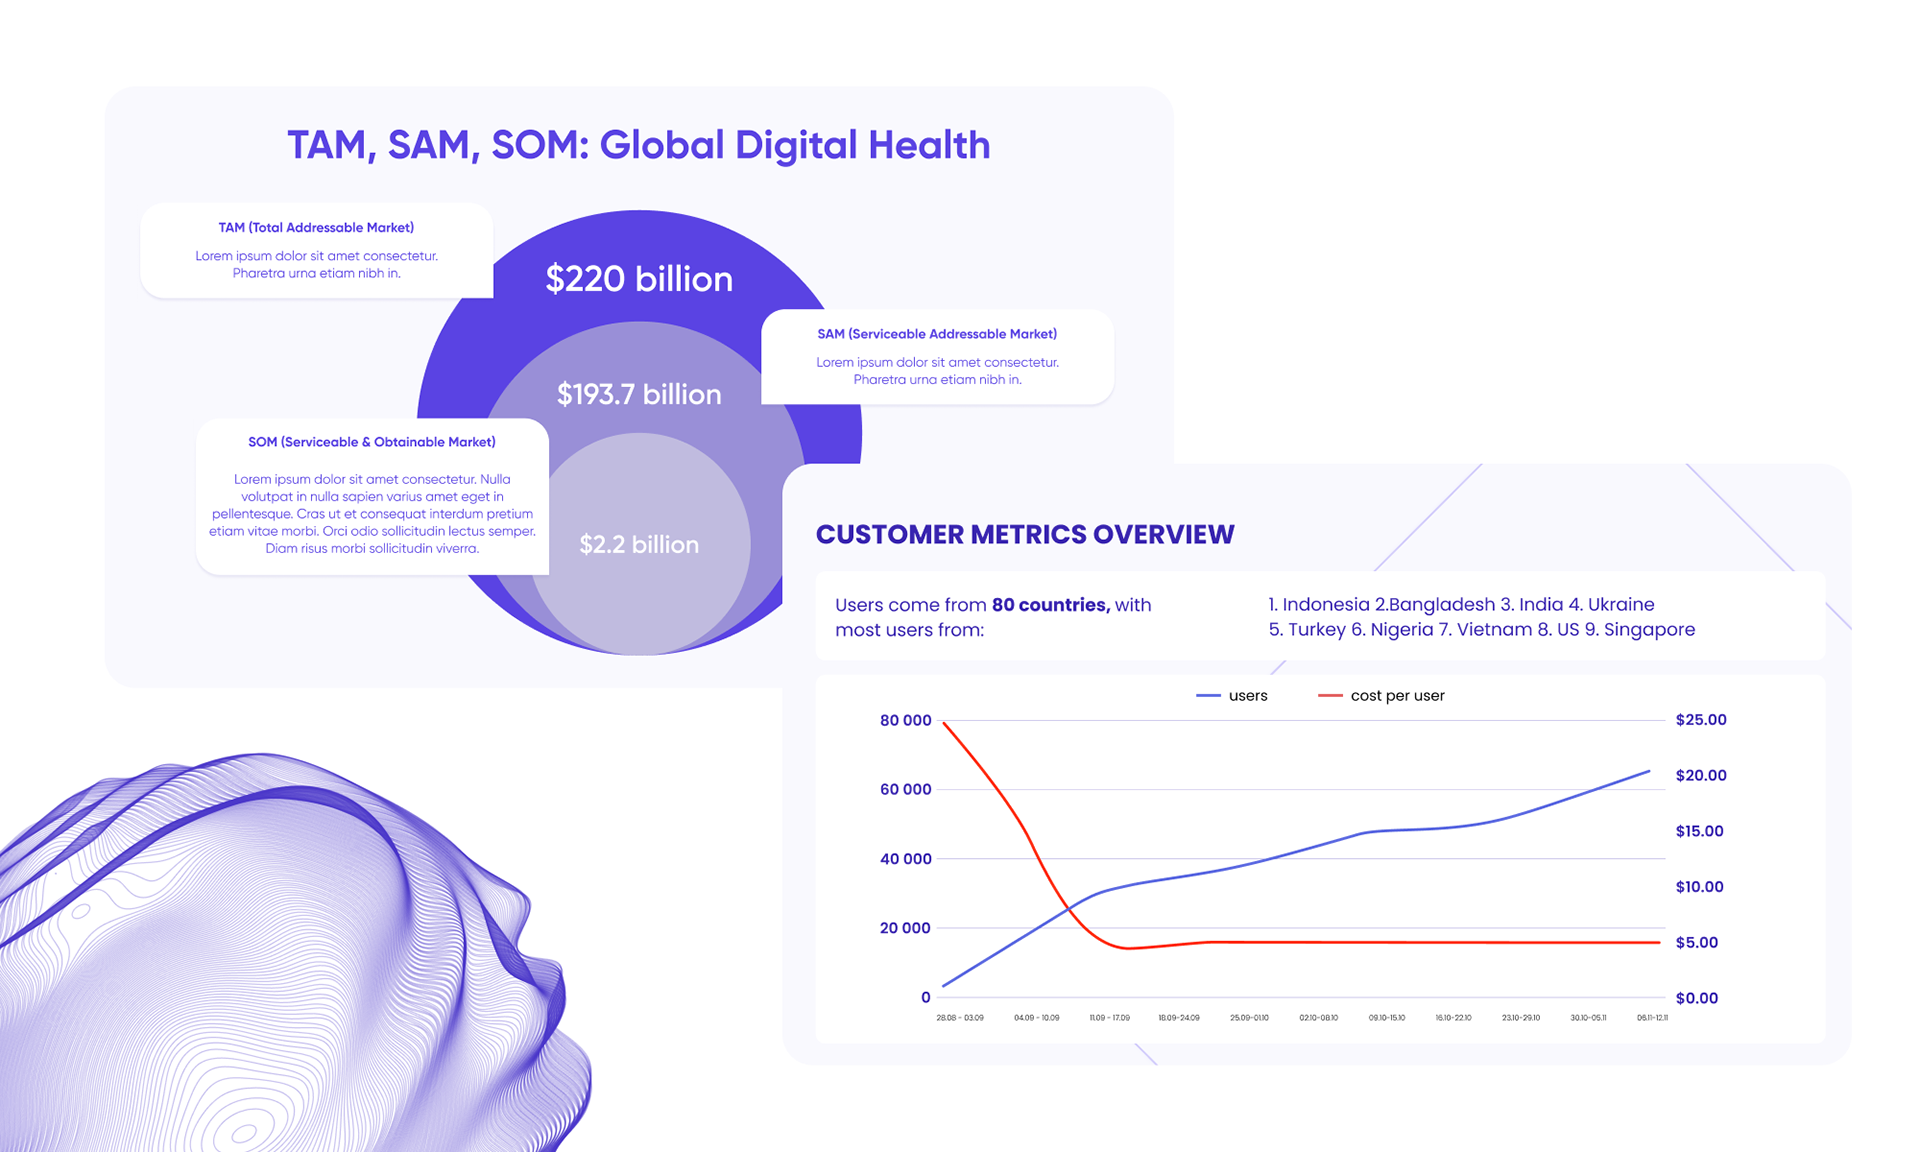
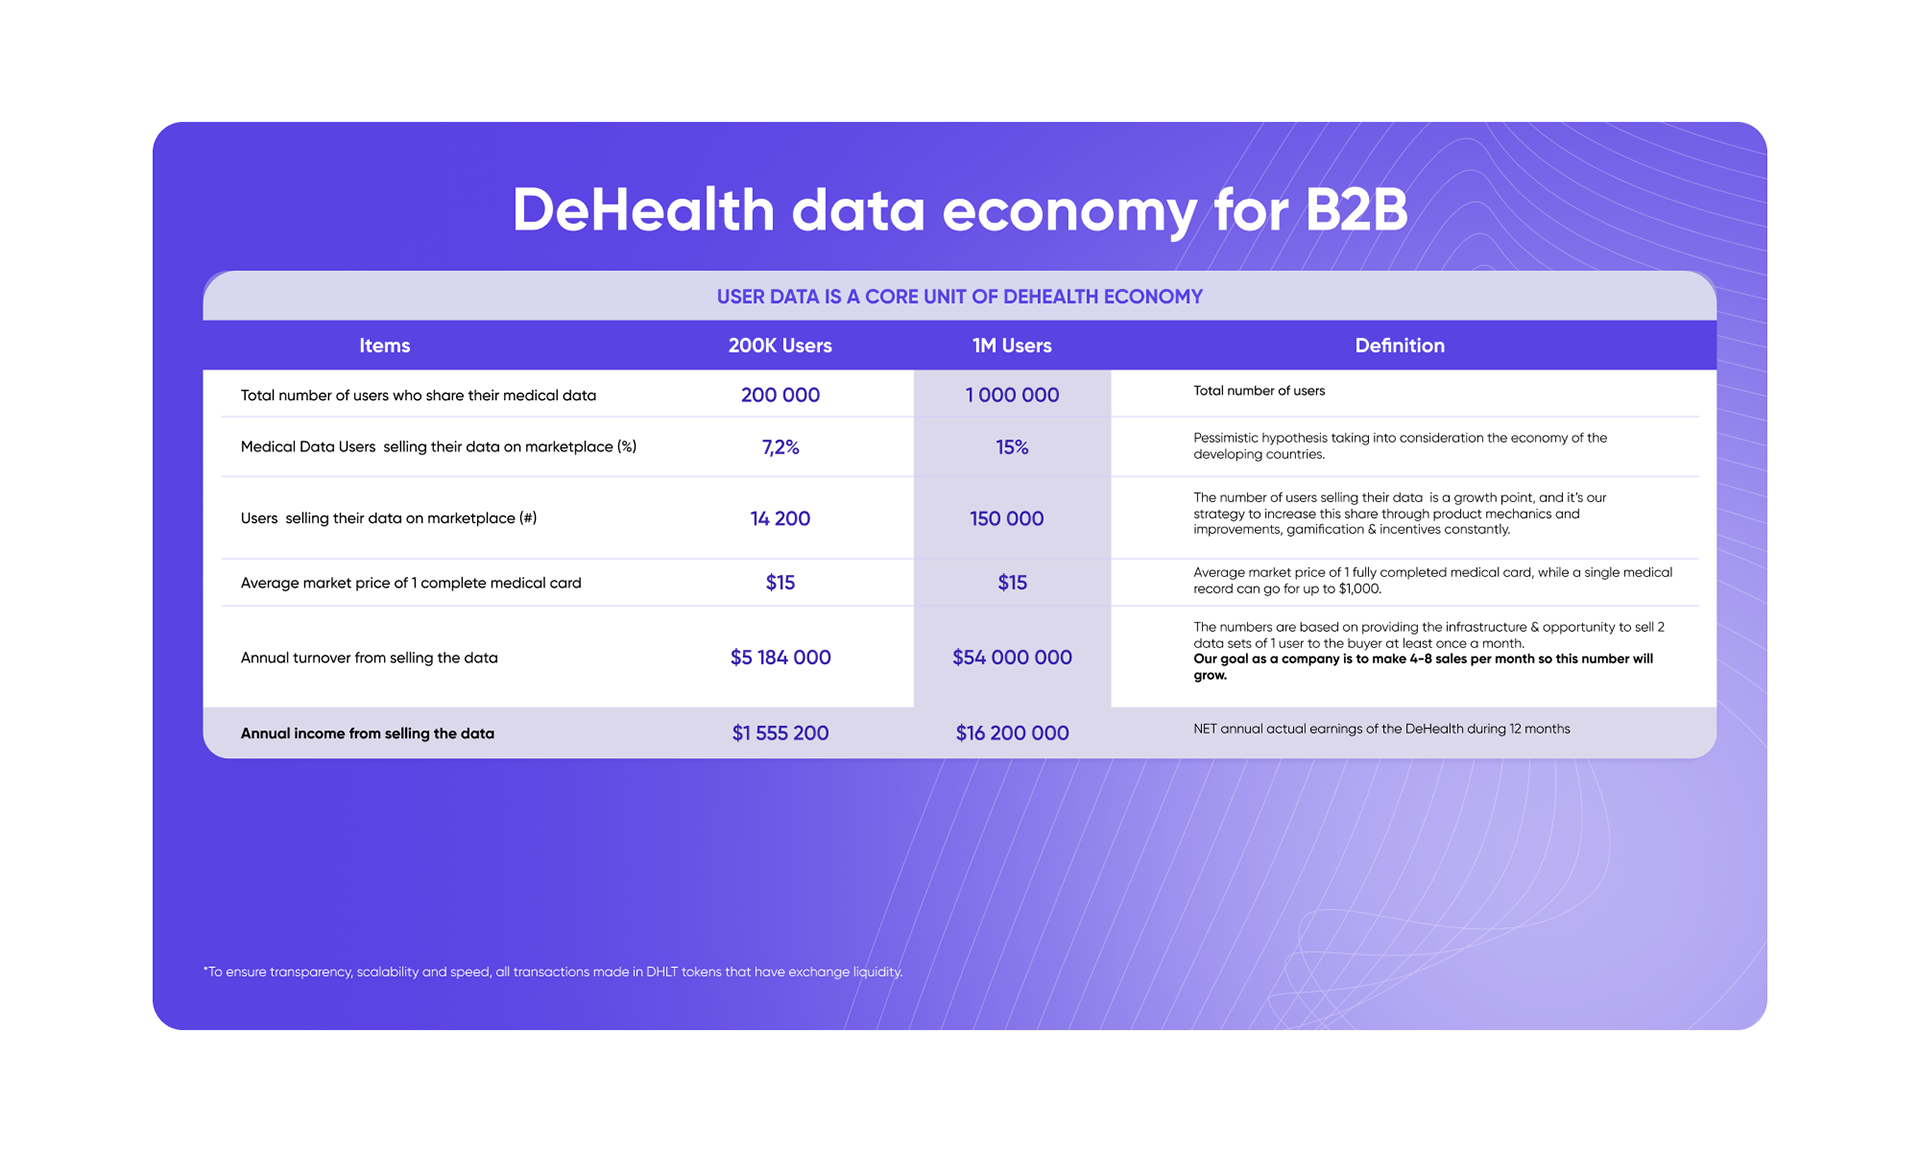
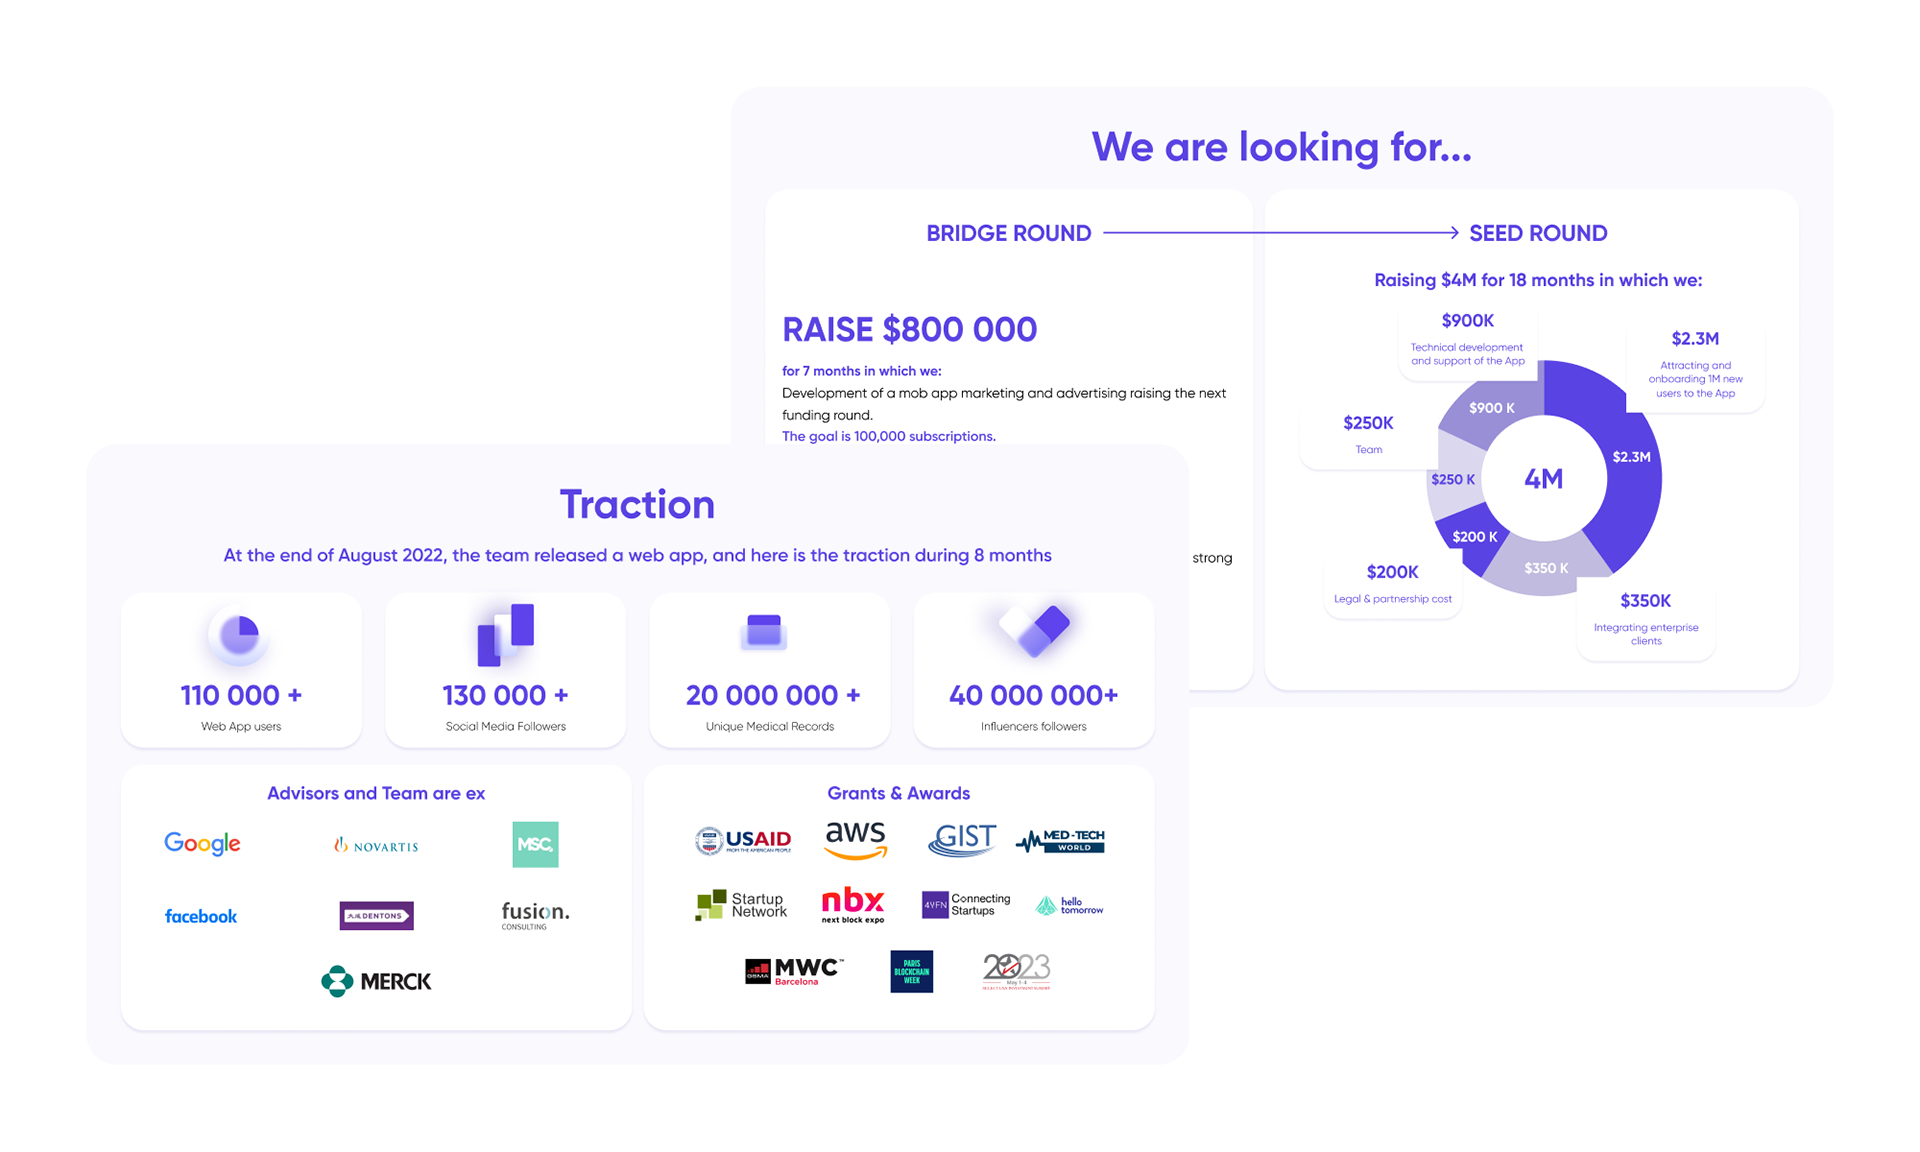
The content was structured in a logical sequence to create a seamless narrative that effectively guides viewers through the information. To maximize clarity, I integrated principles of human perception, leveraging visual hierarchy to highlight key insights using thoughtful color, typography, and layout. Additionally, I selected appropriate visualization formats, such as bar charts, pie charts, and infographics, to present the data in a way that is both visually appealing and easy to interpret.
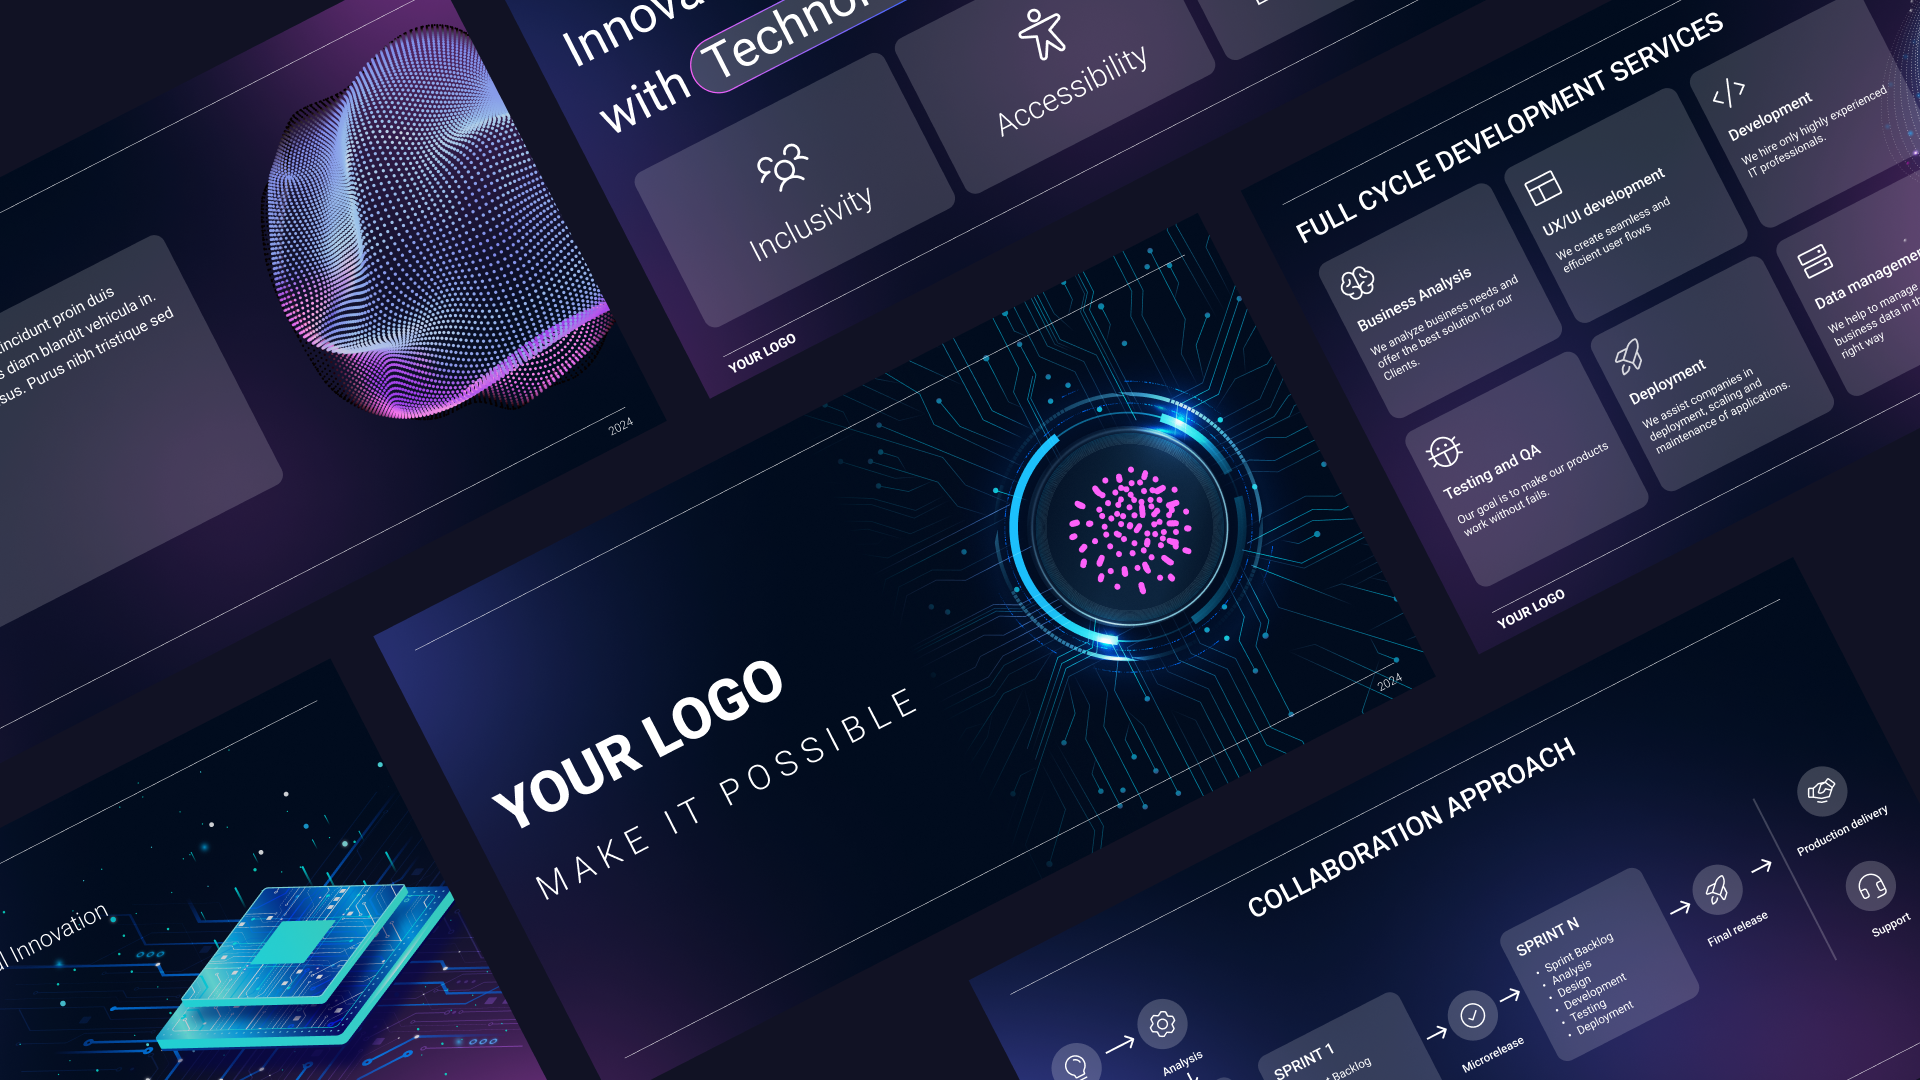
To enhance the overall visual impact, I employed a clean and modern design aesthetic, ensuring alignment with the brand identity where necessary.
This approach ensured that the statistical information was presented in a format that is not only visually attractive but also intuitive, enabling the audience to quickly grasp key insights and make informed decisions.